
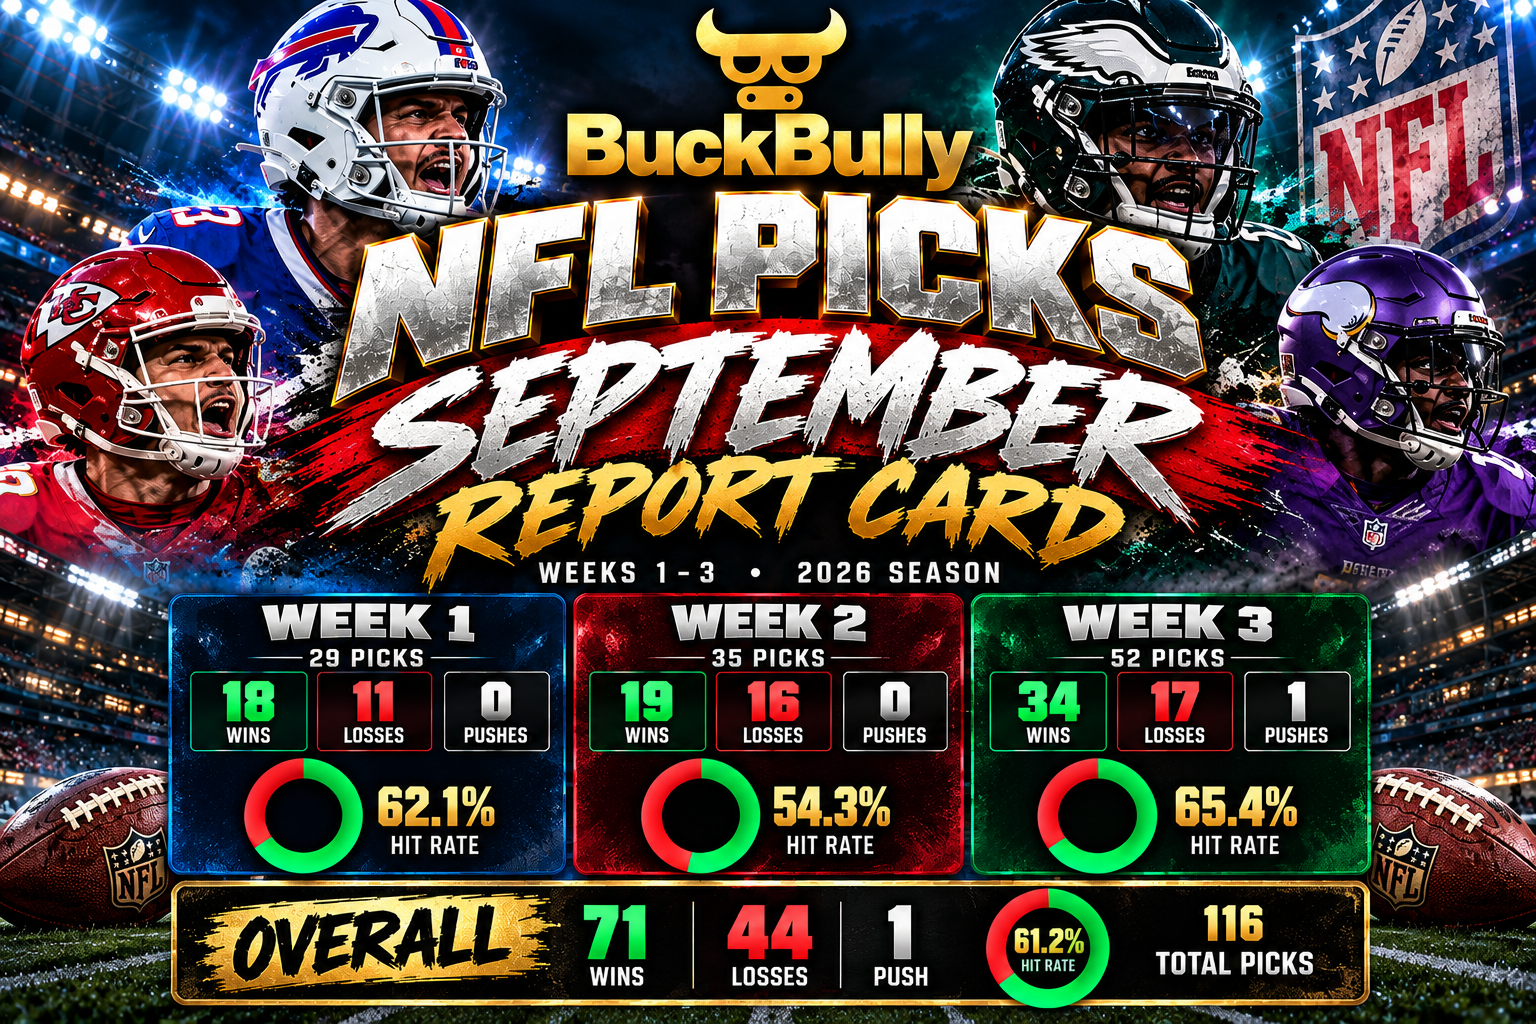
Surviving a Brutal Start to the 2026 Season
Three weeks into the 2026 NFL season, one thing is already clear: September had no interest in following the script.
Favorites went down. Expected shootouts turned into defensive battles. Player props that looked solid on paper disappeared by halftime. Injuries altered matchups, backups were forced into important roles, and several established teams and stars performed nowhere near preseason expectations.
For anyone making NFL predictions, it was the kind of opening month that tests whether your process can survive when the league gets unpredictable.
For BuckBully, the answer through three weeks was 71 wins, 44 losses and one push across 116 documented picks — a 61.2% overall hit rate.
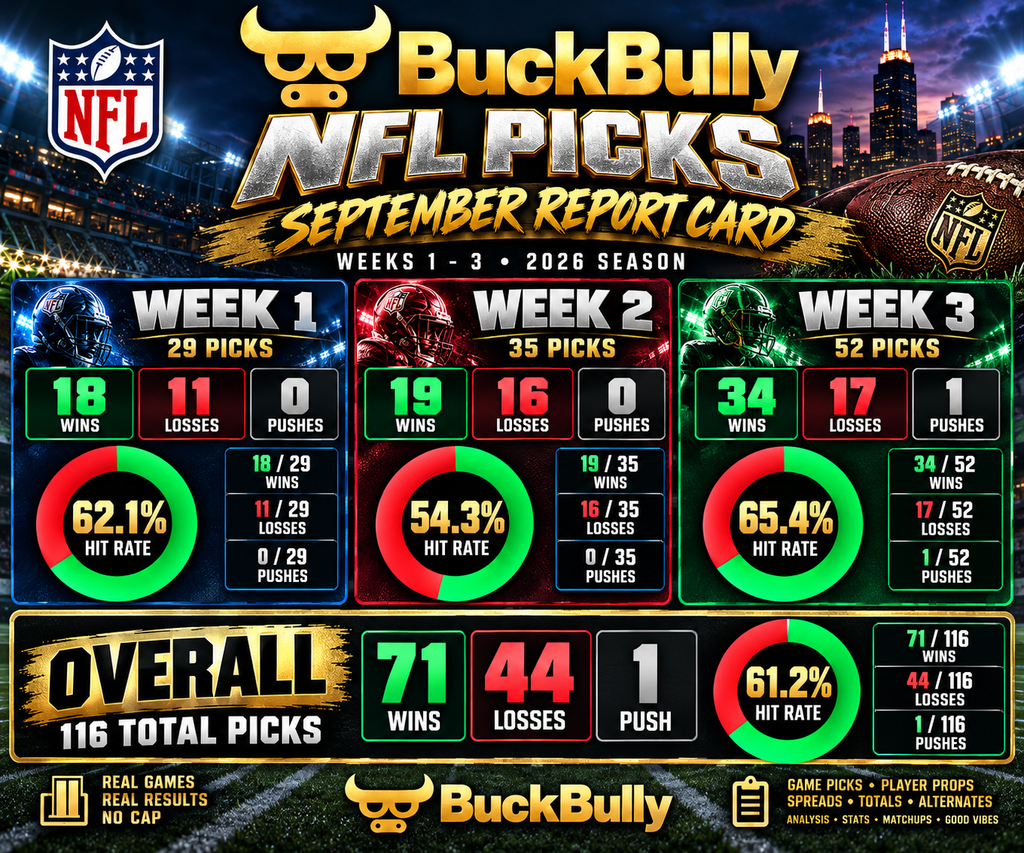
That included everything from moneylines and spreads to game totals, alternate lines and player props. My original picks sheet shows just how quickly September turned into a minefield: the Rams, Titans and Texans moneylines were among the Week 1 misses, while several individual props went the other direction as well.
Week 1: 18–11 — 62.1%
Week 1 actually produced a strong start for the card despite immediately showing how strange this season could become.
Baltimore handled Indianapolis 41–23, Jacksonville hammered Cleveland 34–10 and Pittsburgh beat Atlanta 20–13. But elsewhere, Minnesota beat Green Bay 39–22, Arizona knocked off the Chargers 26–14 and Las Vegas beat Miami 27–13.
The picks reflected both sides of that chaos.
Jonathan Taylor over 75 rushing yards and Lamar Jackson over 36 rushing yards hit in Baltimore-Indianapolis. Bucky Irving scored, Baker Mayfield cleared his rushing number and Amon-Ra St. Brown found the end zone. But Kyren Williams finished with only 41 rushing yards against San Francisco, Trevor Lawrence threw for 245 when I needed him under 232, and Tampa Bay +4.5 fell short when Cincinnati won by six.
Even before kickoff, injuries were complicating the board. NFL.com’s Week 1 injury report contained significant absences across numerous teams, including Atlanta entering its opener without quarterbacks Tua Tagovailoa and Michael Penix Jr.
Week 1 grade: 18–11 (62.1%)
Not perfect, but a profitable-looking percentage on paper and a solid opening performance considering how quickly preseason assumptions began falling apart.
Week 2: The NFL Fights Back
Week 2: 19–16 — 54.3%
This was the grind.
Philadelphia beat Tennessee, but only 24–20, costing the Eagles -7 selection. Minnesota held Chicago to three points. New Orleans upset Baltimore 24–17. New England crushed Pittsburgh 20–3. Carolina demolished Atlanta 34–3. Cleveland beat Tampa Bay 23–19.
Those weren’t minor deviations from projections. Several games completely reversed what many bettors would have expected from the matchup.
My sheet shows exactly where the damage came from. Saquon Barkley was held to nine rushing yards against Tennessee. D’Andre Swift finished with 45 when I needed 50+. Derrick Henry had only 16 rushing attempts against a 19-attempt over. Joe Burrow missed 225 passing yards, while Bijan Robinson fell short of both my 80+ rushing-yard play and his receptions over.
But the card still finished above .500 because other reads held up.
19 wins. 16 losses. 54.3%.
Sometimes handicapping isn’t about dominating a slate. It’s about surviving the slate when the league decides nothing is going to behave normally.
Week 3: BuckBully’s Best Week
Then came the bounce-back.
Week 3: 34–17–1 — 65.4%.
And Week 3 may have been the wildest slate yet.
NFL.com described the Sunday slate as dominated by nail-biters: 12 of 14 Sunday games finished within one score. Washington stunned defending champion Seattle 33–31 despite playing without Jayden Daniels, while Denver came back to beat the Rams 30–26.
Even the supposedly safer player projections weren’t safe. My Week 3 card had Jalen Hurts at 225+ passing yards; he finished with 153. Josh Allen’s 239.5 passing-yard over ended at 204. C.J. Stroud’s 236.5 over finished at 167, Trevor Lawrence’s 228.5 over at 182, and Matthew Stafford exploded for 390 yards when the selection was under 241.5.
That’s what makes 34 wins on a 52-pick card stand out.
The NFL was getting less predictable, but the BuckBully card became more accurate.
The September Report Card
The progression tells the story:
Week 1: 18–11 — 62.1%
Week 2: 19–16 — 54.3%
Week 3: 34–17–1 — 65.4%
Overall: 71–44–1 | 116 Picks | 61.2% Hit Rate
And that 61.2% means more to me than simply posting the winning picks.
I’m keeping the losses visible too.
Anybody can post a screenshot after a game and pretend they knew what was coming. BuckBully’s goal is different: document the selections, compare the predictions against what actually happened, identify what worked and what didn’t, and keep improving the process.
September provided plenty to study.
Player usage can change overnight. Injuries can destroy an otherwise logical matchup. A heavy favorite can look ordinary. A backup quarterback can change an entire game. A rushing prop can have the perfect matchup and still fail because the game script disappears.
And sometimes the analysis is right and football simply happens.
October: Adjust, Don’t Chase
The biggest lesson from September isn’t to abandon projections. It’s to adjust faster.
Three weeks of actual 2026 data now gives us information that preseason projections couldn’t: real offensive tendencies, defensive weaknesses, snap counts, target distribution, rushing workloads and how coaches are actually using their personnel.
September was the introduction.
October is where those early assumptions start getting replaced by evidence.
116 picks. 71 wins. 44 losses. 1 push. 61.2%.
Not undefeated. Not pretending to be.
Just documented picks, real results and another month of football to attack.
Putting the 61.2% Hit Rate in Perspective
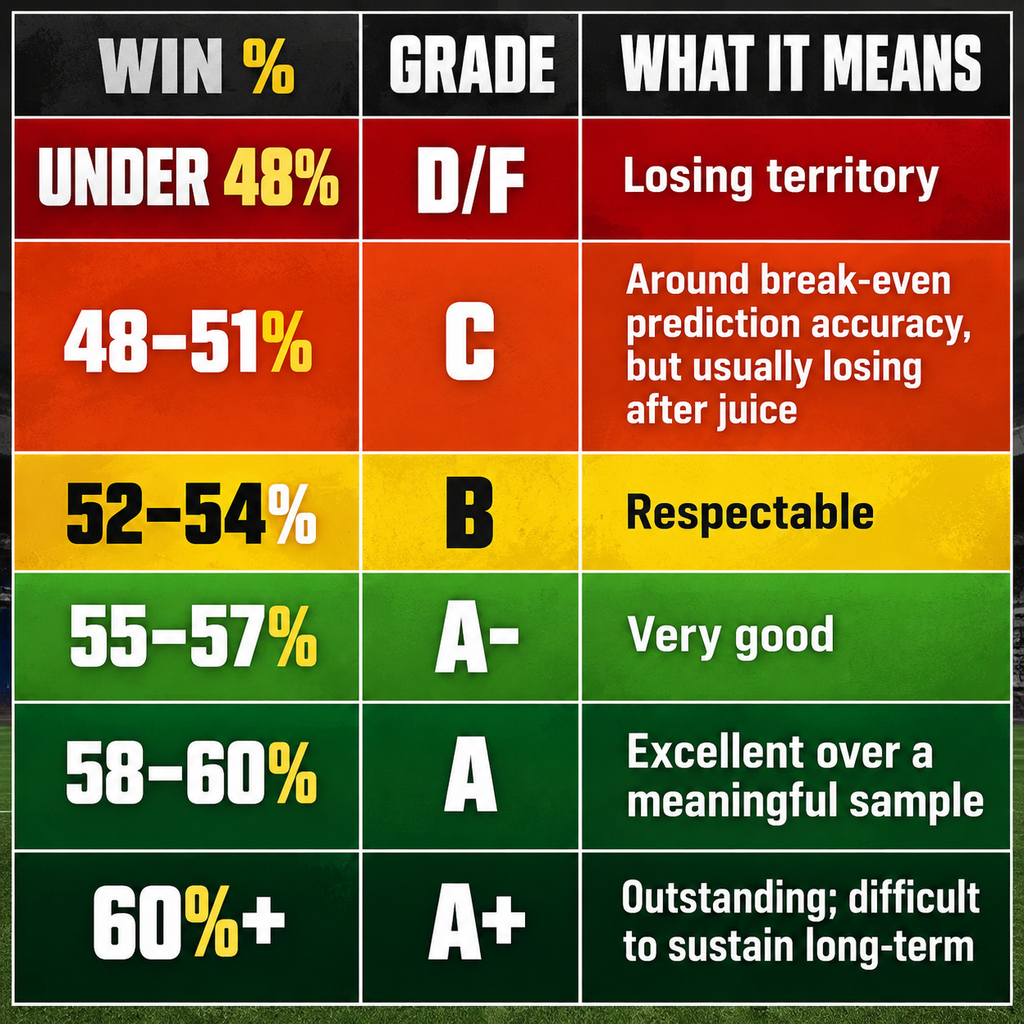
When grading NFL picks against the spread, totals, and player props, the standard is much tougher than simply picking which team will win. At typical -110 odds, the break-even point is approximately 52.38%, meaning a bettor has to perform above that level just to overcome the sportsbook’s standard pricing. Using that benchmark, 52–54% is respectable, 55–57% is very good, 58–60% is excellent, and anything above 60% over a meaningful sample is outstanding and difficult to sustain long-term. That puts BuckBully’s September performance—71 wins, 44 losses and one push across 116 picks, a 61.2% overall hit rate—firmly in A+ territory under this grading scale. The most encouraging part wasn’t perfection; it was maintaining that percentage across a diverse card of spreads, totals, moneylines and player props during an especially unpredictable opening month.
BuckBully — Where Collectibles Meet Markets… and Sundays Meet the Numbers.