
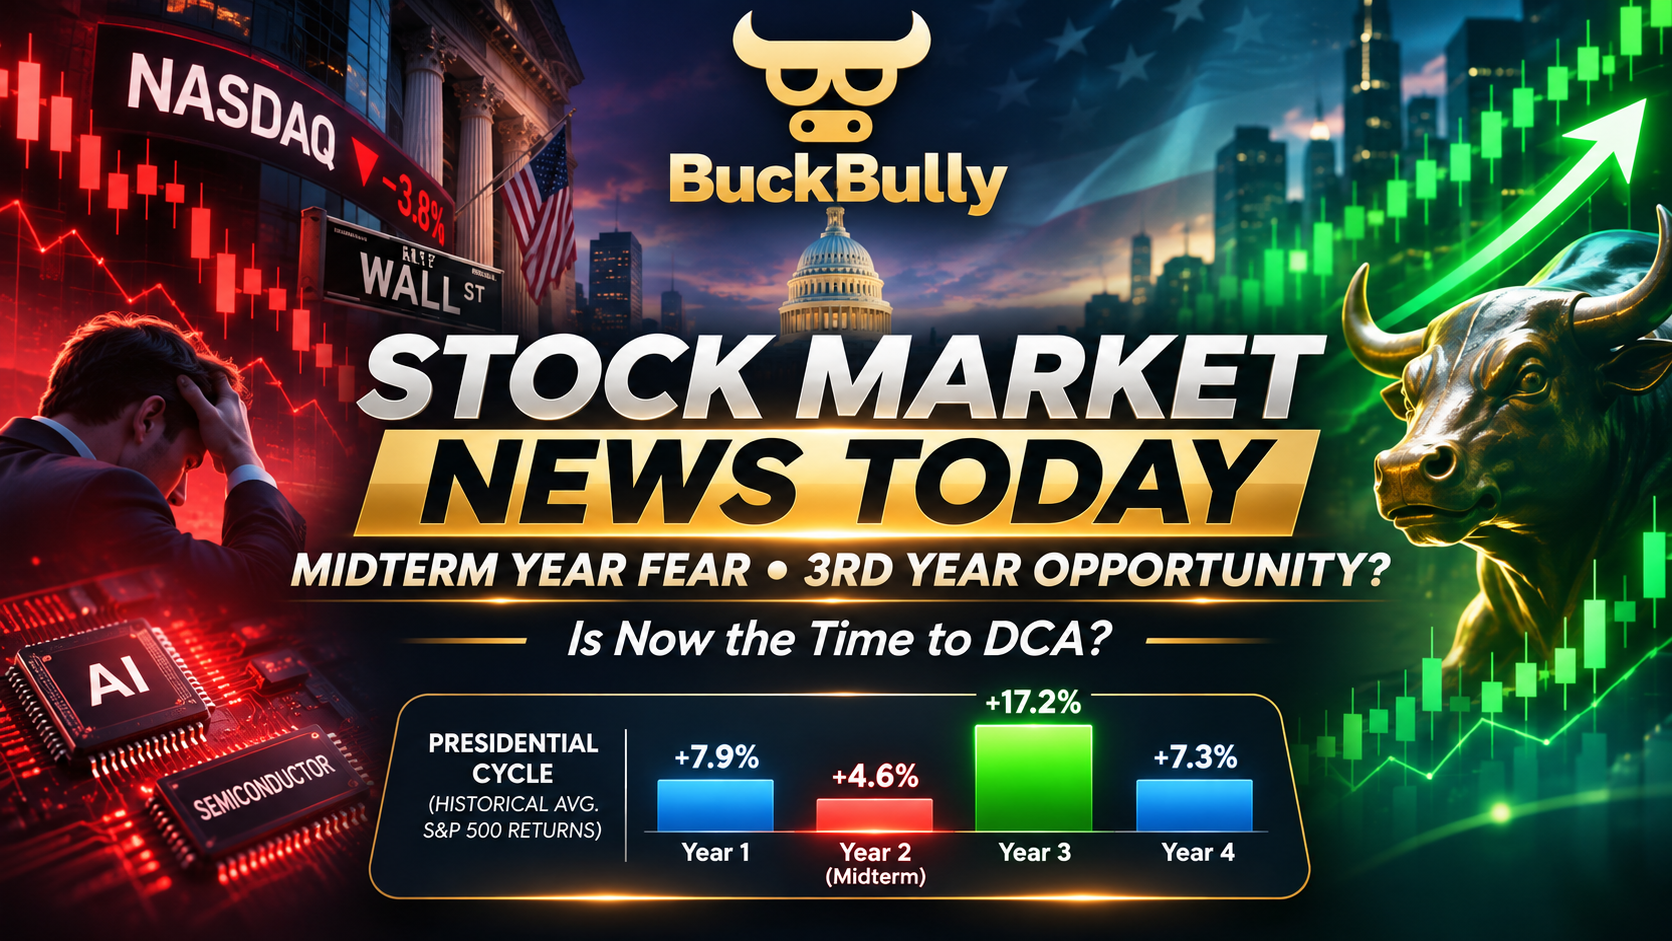
Stock Market Bloodbath:
Wall Street’s AI trade is under pressure. History says the third year of the presidential cycle has often delivered powerful gains. Could today’s fear create tomorrow’s opportunity?
NOVEMBER 6, 2026 | BUCKBULLY MARKET RESEARCH
📉 Wall Street’s November 5 Meltdown
Investors entered November expecting post-election clarity. Instead, a dramatic sell-off in artificial intelligence, semiconductors and data-center-related stocks sent major indexes sharply lower.
Thursday’s closing figures and Friday’s jobs data. This article is a dated market snapshot, not a live quotation service.
What Triggered the AI Sell-Off?
🤖 AI Valuations
Investors are questioning whether massive spending on AI chips, cloud infrastructure and data centers will produce profits quickly enough to justify elevated valuations.
🏛️ Political Change
Democratic congressional victories raised expectations of greater scrutiny of AI, energy use and data-center development. Regulation remains an evolving risk, not a predetermined outcome.
💵 Interest Rates
Higher Treasury yields and inflation concerns can reduce what investors are willing to pay for future earnings, particularly in expensive growth stocks.
🔄 Crowded Trades
When investors concentrate in the same popular sector, falling prices can trigger additional selling and forced reductions in exposure.
November 6: Jobs Data Complicates the Picture
The October employment report showed 165,000 additional nonfarm jobs and unemployment of 4.1%. That suggests resilience in the labor market, but it may also strengthen the argument for keeping interest rates elevated to restrain inflation.
Good economic news is not always immediately good news for stock prices. Strong employment can support consumer spending and corporate earnings while simultaneously pushing bond yields higher.
🏛️ The Presidential Market Cycle
One of Wall Street’s most interesting historical patterns is the four-year presidential cycle. Historically, the midterm year has been the weakest, while the following year has produced the strongest average return.
Interactive Historical Returns
Tap a presidential-cycle year to explore its historical profile.
Historical S&P 500 price returns, 1950–2023. Carson Investment Research / FactSet. Annual calendar-year averages exclude dividends and do not forecast 2027.
📈 The 19-for-19 Post-Midterm Pattern
Using S&P 500 price returns measured from election day to approximately 12 months afterward, the index finished higher following all 19 U.S. midterm elections from 1950 through 2022.
Explore Three Past Midterm Cycles
The 12-month post-election gain followed a year dominated by inflation, rising interest rates and major technology-stock losses.
Could 2027 Be Another Big Year?
There are competing forces that will determine whether the historical third-year pattern repeats. Elections alone do not drive stock returns. Corporate earnings, valuations, interest rates and economic activity matter more over time.
🐂 Bull Case
AI companies continue increasing revenue and demonstrating returns on infrastructure spending. Inflation moderates, interest rates stabilize, productivity improves and investors regain confidence.
Potential outcome: Investors broaden their purchases beyond a handful of technology giants, supporting a more durable market recovery.
🐻 Bear Case
Data-center construction slows, AI monetization disappoints, energy costs remain elevated and interest rates stay restrictive. Earnings estimates may fall as investors reduce risk.
Potential outcome: A rebound proves temporary and broader markets experience another correction or prolonged consolidation.
What Matters Most Going Forward?
| Indicator | Bullish Signal | Warning Signal |
|---|---|---|
| Inflation | Sustained moderation | Reacceleration |
| Federal Reserve | Stable or easing rates | Further tightening |
| AI earnings | Revenue and margins improve | Spending outpaces returns |
| Market breadth | More sectors participate | Recovery limited to a few stocks |
| Employment | Resilient hiring | Rapid deterioration |
| Credit conditions | Stable borrowing markets | Rising defaults and stress |
💰 Is It Time to Dollar-Cost Average?
Dollar-cost averaging, or DCA, means investing a fixed dollar amount at regular intervals regardless of short-term price movements.
When the market drops, the same contribution buys more shares. When prices rise, those accumulated shares may benefit from a recovery.
Interactive DCA Investment Calculator
Illustrative gain: $244
Same total invested up front: $3,516
Illustration assumes a starting share price of $100, a smooth month-by-month price path to the selected ending return, contributions at the beginning of each month, no dividends, fees or taxes. The selected return describes the entire investment period, not an annualized rate. Actual markets fluctuate irregularly, so real results will differ.
📊 Investment Strategy Simulator
Compare the dollar value of a hypothetical $10,000 investment after one year under three possible market scenarios.
Hypothetical Portfolio Path
The simulator assumes a smooth illustrative path, not a prediction or a backtest.
🔍 What Should Investors Watch?
Rather than automatically treating every falling stock as a bargain, investors can build a quality-focused watchlist and monitor financial fundamentals.
SPY / VOO
S&P 500 exposure
Broad exposure to major U.S. companies. A possible diversified foundation for long-term investing.
QQQ
Nasdaq-100 exposure
Greater exposure to large growth and technology companies, accompanied by concentration and valuation risks.
NVDA / AMD
Semiconductor watch
Examine chip demand, earnings growth, margins, competition and dependence on AI infrastructure spending.
MSFT / GOOGL
AI platform watch
Review cloud revenue, capital spending, free cash flow and the monetization of AI services.
BRK.B / Defensive Sectors
Portfolio balance
Consider cash generation, business diversification, valuation and resilience during economic slowdowns.
Treasuries / Cash
Liquidity reserve
Short-term Treasury instruments and cash reserves may help investors meet expenses without selling equities during a downturn.
Watchlist examples are research candidates, not individualized buy recommendations. Prices and valuations must be reviewed before any transaction.
🗓️ The Road From 2026 to 2027
Investors digest the election results, AI infrastructure concerns and volatile technology valuations.
Markets focus on inflation, employment, financial conditions and the central bank’s next decision.
Companies will need to demonstrate that AI investment can translate into sustainable profits and cash flow.
Monitor employment, inflation, productivity, consumer spending and the direction of earnings revisions.
Compare actual market performance against the historical third-year average while recognizing that political seasonality is not a trading guarantee.
✅ BuckBully’s DCA Checklist
Use this interactive checklist to evaluate whether your finances and investment plan support regular contributions.
0 of 7 considerations reviewed
🐂 Final Verdict: Fear Today, Opportunity Tomorrow?
Wall Street has experienced another reminder that popular investments are not immune to sudden repricing. The AI boom may continue producing transformative technologies, but investors still need to ask whether today’s valuations adequately reflect tomorrow’s risks.
History provides an intriguing framework. Midterm years have often been volatile, and the third year of the presidential cycle has historically produced the strongest average returns. However, those averages cannot tell us exactly when a market bottoms or whether the next year will be profitable.
The question isn’t just whether the market will recover. It’s whether your investment plan can survive the journey.