
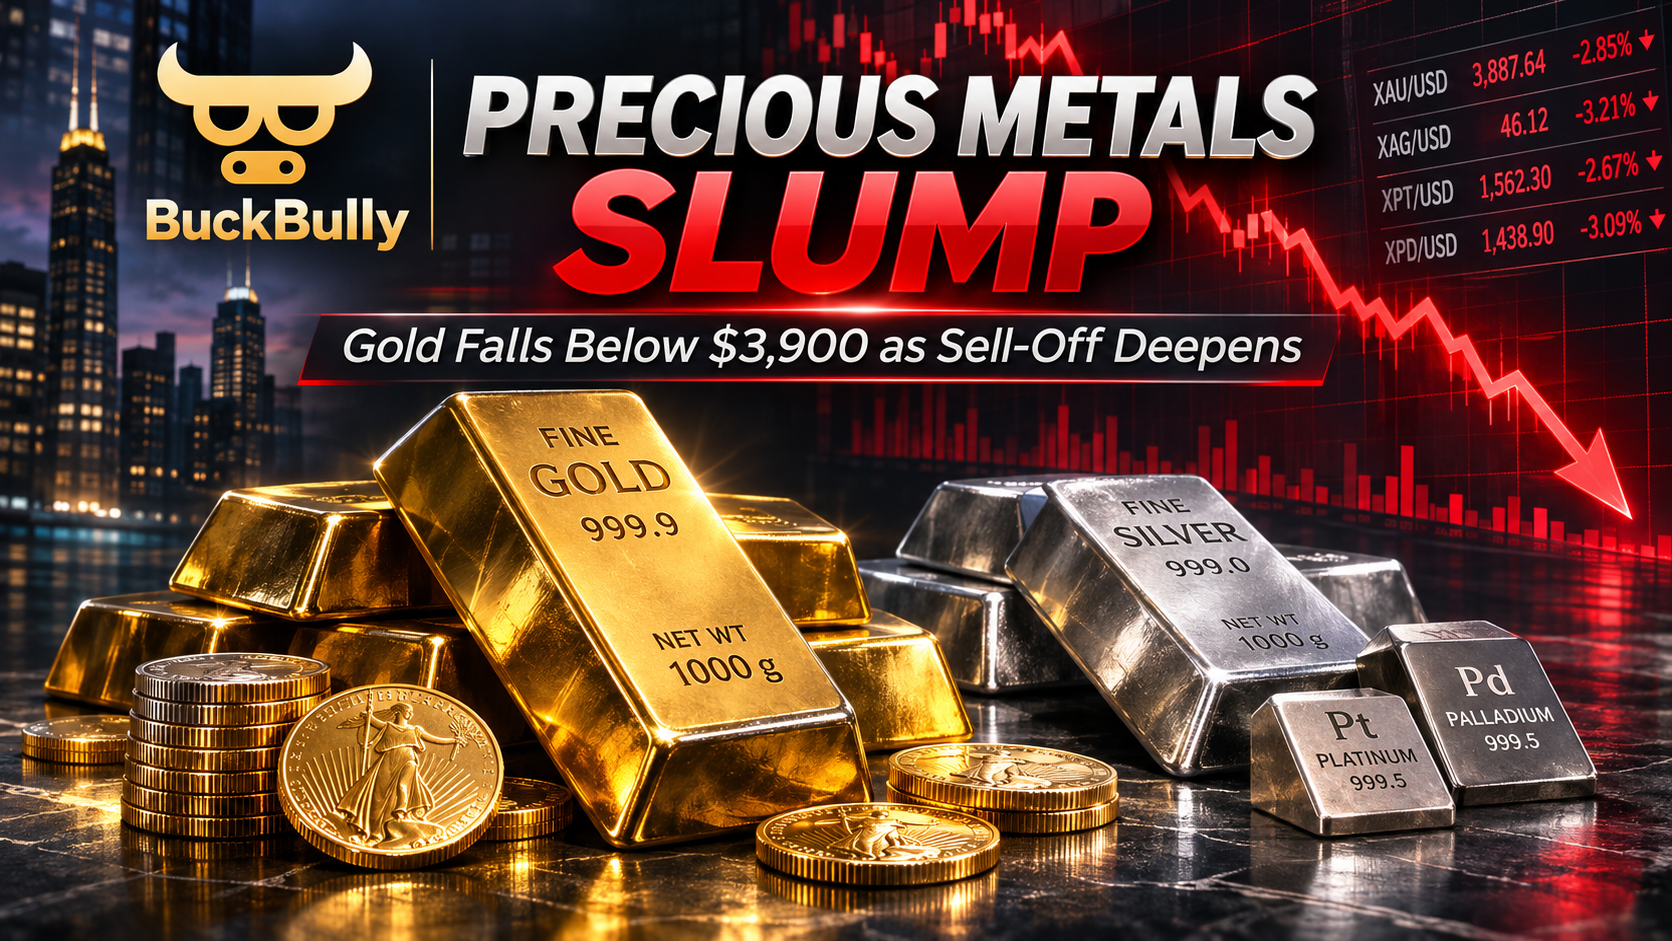
Gold Crashes Below $3,900: Is the Precious Metals Boom Unraveling?
Gold has fallen to a one-year low, silver is under heavy pressure, and Wall Street is turning bearish. But retail investors are still looking for a comeback.
MARKET CORRECTION GOLD • SILVER • PLATINUM • PALLADIUMThe Precious Metals Sell-Off Explained
Gold’s reputation as a safe haven is facing another difficult test. The metal plunged below the psychologically important $3,900 mark during Friday’s sell-off, while silver and other precious metals experienced sharp losses.
After an extraordinary rally earlier in 2026, investors are reassessing the outlook for interest rates, inflation, economic growth and global political uncertainty.
Gold reached approximately $4,082.50 during the week before declining to a reported low near $3,870.25. Instead of attracting immediate safe-haven buying, the broader market turmoil prompted investors to reduce exposure and raise cash.
At BuckBully, we’re watching whether this decline represents an overdue correction or the beginning of a more prolonged precious metals downturn.
Precious Metals Price Watch
Historical Kitco spot bid snapshot from October 30, 2026, around 12:55 p.m. Eastern. USD per troy ounce. Not live prices.
Key level: $3,900
Key zone: $45–$55
Industrial demand sensitive
Automotive sector exposure
Interactive Metals Performance
Select a metal to compare the reported snapshot losses and examine its market outlook.
Gold: The Safe-Haven Test
Gold has broken a key psychological level. Traders are watching whether the market can recover $3,900 and ultimately $4,000.
Bar lengths show loss magnitude relative to silver’s 5.77% decline, not absolute prices.
Why Is Gold Falling?
01. Federal Reserve Pressure
The Federal Reserve maintained rates at 3.75%–4.00%. Expectations of possible future tightening make non-yielding gold less attractive relative to interest-bearing assets.
02. Liquidity Shock
The sell-off in technology stocks helped trigger broader liquidation. When traders need cash or face margin calls, even traditional safe-haven assets can be sold.
03. Inflation and Energy
Elevated inflation and energy prices may keep interest rates higher for longer, creating additional pressure on precious metals.
04. Political Uncertainty
The U.S. midterm elections and geopolitical tensions could increase volatility. Their effect on gold will depend on investors’ demand for cash, dollars and safe-haven assets.
Wall Street vs. Main Street: The Sentiment Divide
Professional analysts have become considerably more pessimistic, but retail investors still hold a narrow bullish majority.
Wall Street — 16 Analysts
Main Street — 184 Respondents
Kitco weekly gold survey, October 30. Percentages are rounded and may not sum to 100.
Gold’s Most Important Price Levels
The breakdown has put several potential support and resistance zones into focus. These are technical reference levels, not guaranteed price targets.
| Gold price | Market significance |
|---|---|
| $4,082 | Approximate recent weekly high |
| $4,000 | Psychological resistance after breakdown |
| $3,900 | Important recovery threshold |
| $3,870 | Reported Friday low zone |
| $3,850–$3,750 | Potential lower trading zone discussed by analysts |
| $3,500 | Deeper downside reference if support fails |
Interactive Gold Price Scenario Lab
What would a recovery or another sell-off mean for an investor holding physical gold? Select a price scenario below, or adjust your own target.
Based on $3,892.60/oz, without premiums, spreads, commissions, storage or taxes.
Precious Metals Holdings Calculator
Estimate the spot-value exposure of your gold, silver, platinum or palladium holdings. Enter your purchase cost per troy ounce to calculate an illustrative unrealized gain or loss.
Uses the October 30 snapshot and an assumed percentage selling fee. Actual dealer bids, premiums, assay costs, shipping, taxes and spreads may differ.
What Could Move Precious Metals Next?
Explore the catalysts we’re watching heading into the next trading week.
U.S. Midterm Elections — November 3
Unexpected election outcomes or post-election policy uncertainty could reshape demand for defensive assets. The dollar, bond yields and liquidity conditions may matter as much as political headlines.
U.S. Nonfarm Payrolls — November 6
A weaker-than-expected labor market report could reduce expectations of additional interest rate hikes, potentially supporting gold. Stronger employment or wage data could reinforce a hawkish policy outlook.
Federal Reserve Expectations
Markets are sensitive to anticipated real interest rates. Lower expected real rates generally improve gold’s relative appeal, while higher real rates can pressure the metal.
Oil and Geopolitical Tensions
Escalating geopolitical risks may boost safe-haven demand, but rising energy prices can also increase inflation concerns and interest rate expectations. The resulting direction is not automatic.
Technology Stocks and Forced Selling
More equity-market liquidation could temporarily pressure precious metals as investors raise cash. Stabilizing risk markets could remove one source of forced selling.
Industrial Demand for Silver, Platinum and Palladium
These metals have important industrial uses. Expectations for manufacturing, electronics, automotive catalysts and substitution trends can change their outlook independently from gold.
Is the Sell-Off a Buying Opportunity?
The decline may offer better entry prices for long-term collectors and investors, but falling prices alone do not prove that a market has reached its bottom.
For physical bullion buyers, premiums over spot and dealer buyback spreads can determine whether a seemingly attractive purchase is worthwhile. Smaller bars and collectible coins may carry higher premiums than large bullion products.
For investors focused on short-term price movements, recovering key technical levels and seeing stability in bond yields, monetary-policy expectations and equity markets may matter more than guessing the precise bottom.
Bullish Recovery Case
Gold reclaims $3,900, returns above $4,000 and stabilizes as liquidity pressures fade or expectations of tighter monetary policy diminish.
Bearish Continuation Case
Gold remains below former support, selling pressure persists, and investors begin testing deeper downside zones.
Our focus is on confirmation, not chasing panic. Watch whether gold can reclaim lost support, whether silver can stabilize around its critical $45–$55 zone, and whether economic data changes expectations for interest rates.
The Bottom Line
Gold’s fall below $3,900 marks a significant shift in sentiment. The precious metals market is now testing whether the fundamental arguments for holding hard assets can withstand tighter financial conditions and a broad rush for liquidity.
Silver’s steeper percentage decline demonstrates how quickly price volatility can spread across the metals complex. Platinum and palladium are also exposed to shifting expectations for industrial demand.
For us at BuckBully, the question is no longer simply how high precious metals can climb. It’s whether buyers can establish a durable foundation after this sharp correction.
The next phase will likely be shaped by economic data, Federal Reserve expectations, geopolitical events and the market’s ability to absorb further selling pressure.